Graphic Designers Industry - Market Size, Trends, and Growth - 2025-2030
Industry Overview
This industry comprises establishments primarily engaged in planning, designing, and managing the production of visual communication in order to convey specific messages or concepts, clarify complex information, or project visual identities. These services can include the design of printed materials, packaging, advertising, signage systems, and corporate identification (logos). This industry also includes commercial artists engaged exclusively in generating drawings and illustrations requiring technical accuracy or interpretative skills. Illustrative Examples: Commercial art studios Independent commercial or graphic artists Corporate identification (i.e., logo) design services Medical art or illustration services Graphic design consulting services
Source: U.S. Census BureauMarket Size and Industry Forecast
This research report analyzes the market size and trends in the Graphic Designers industry. It shows overall market size from 2020 to the present, and predicts industry growth through 2030. Revenues data include both public and private companies.
| Historical | Forecasted |
|---|
| 2020 | 2021 | 2022 | 2023 | 2024 | 2025 | 2026 | 2027 | 2028 | 2029 | 2030 |
|---|
| Market Size (Total Revenue) | Included in Report |
| % Growth Rate |
| Number of Companies |
| Total Employees |
| Average Revenue per Company |
| Average Employees per Company |
Source: U.S. government financial dataIndustry Revenue ($ Billions)
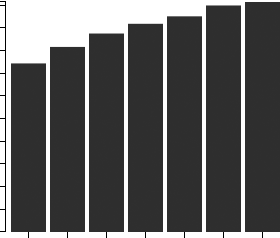
Advanced econometric models forecast five years of industry growth based on short- and long-term trend analysis. Market size includes revenue generated from all products and services sold within the industry.
Geographic Breakdown by U.S. State
Market size by state reveals local opportunity through the number of companies located in the region. Each state's growth rate is affected by regional economic conditions. Data by state can be used to pinpoint profitable and nonprofitable locations for Graphic Designers companies in the United States.
Graphic Designers Revenue by State

Distribution by Company Size
| Company Size | All Industries | Graphic Designers |
|---|
| Small Business (< 5 Employees) | Included |
| Small Business (5 - 20) |
| Midsized Business (20 - 100) |
| Large Business (100 - 500) |
| Enterprise (> 500) |
Graphic Designers Industry Income Statement (Average Financial Metrics)
Financial statement analysis determines averages for the following industry forces:
- Cost of goods sold
- Compensation of officers
- Salaries and wages
- Employee benefit programs
- Rent paid
- Advertising and marketing budgets
The report includes a traditional income statement from an "average" company (both public and private companies included).
| Industry Average | Percent of Sales |
|---|
| Total Revenue | Included |
| Operating Revenue |
| Cost of Goods Sold (COGS) |
| Gross Profit |
| Operating Expenses |
| Operating Income |
| Non-Operating Income |
| Earnings Before Interest and Taxes (EBIT) |
| Interest Expense |
| Earnings Before Taxes |
| Income Tax |
| Net Profit |
Average Income Statement

Cost of Goods Sold
Salaries, Wages, and Benefits
Rent
Advertising
Depreciation and Amortization
Officer Compensation
Net Income
Financial Ratio Analysis
Financial ratios allow a company's performance to be compared against that of its peers.
| Financial Ratio | Industry Average |
|---|
| Profitability Ratios | Included |
| Profit Margin |
| ROE |
| ROA |
| Liquidity Ratios |
| Current Ratio |
| Quick Ratio |
| Activity Ratios |
| Average Collection Period |
| Asset Turnover Ratio |
| Receivables Turnover Ratio |
| Inventory Conversion Ratio |
Graphic Designers Industry Product Mix
| Title | Percent of Workforce | Bottom Quartile | Average (Median) Salary | Upper Quartile |
|---|
| Management Occupations | 7% | Included |
| Chief Executives | 0% |
| General and Operations Managers | 4% |
| Business and Financial Operations Occupations | 6% |
| Arts, Design, Entertainment, Sports, and Media Occupations | 47% |
| Art and Design Workers | 45% |
| Designers | 42% |
| Graphic Designers | 22% |
| Interior Designers | 15% |
| Sales and Related Occupations | 7% |
| Office and Administrative Support Occupations | 15% |
| Production Occupations | 7% |
Government Contracts
The federal government spent an annual total of
$32,165,422 on the graphic designers industry. It has awarded 713 contracts to 217 companies, with an average value of $148,228 per company.
Top Companies in Graphic Designers and Adjacent Industries
| Company | Address | Revenue
($ Millions) |
|---|
Included |
